Plot the distribution of the mapped reads
Source:R/distribution_mapped_reads.R
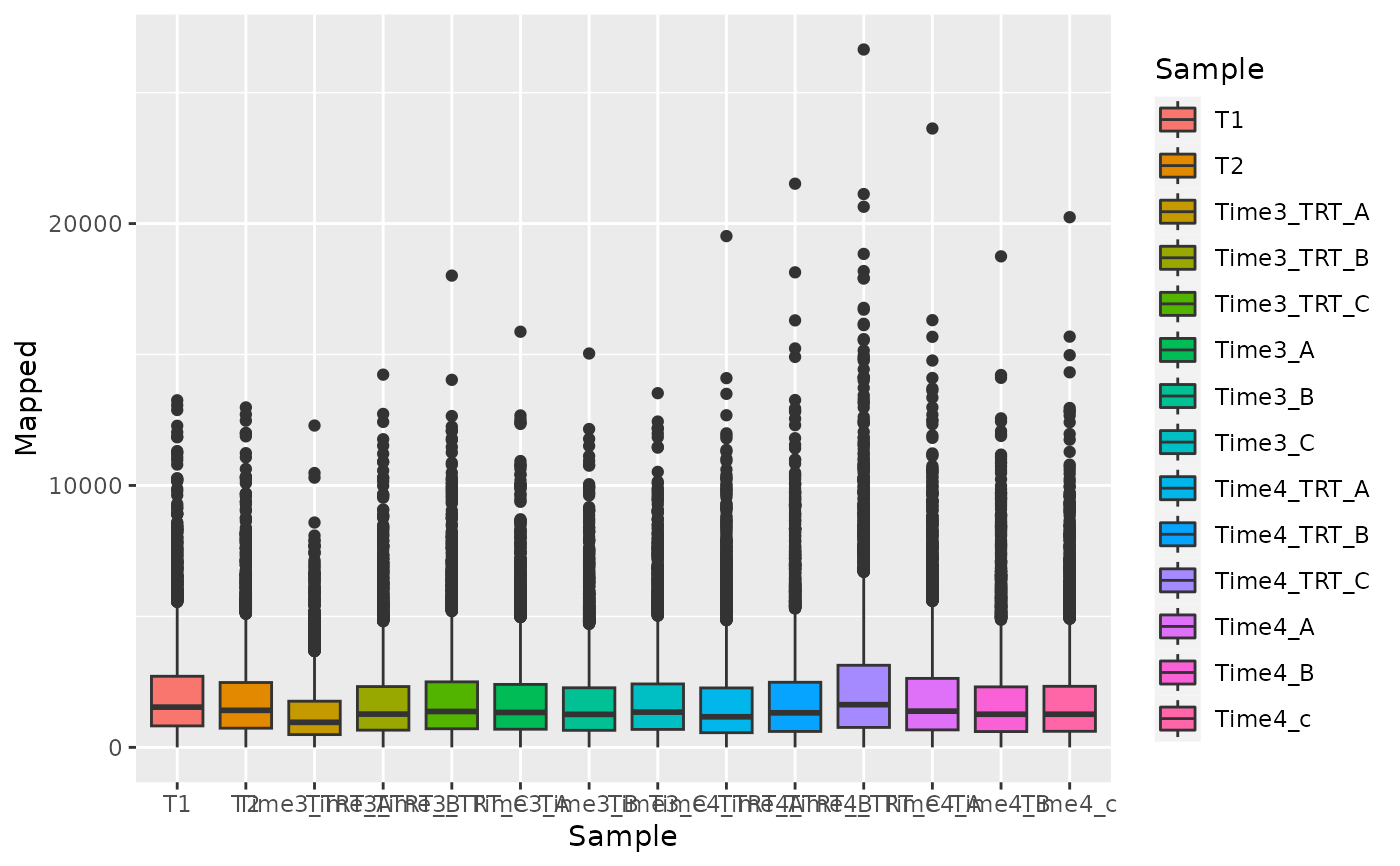
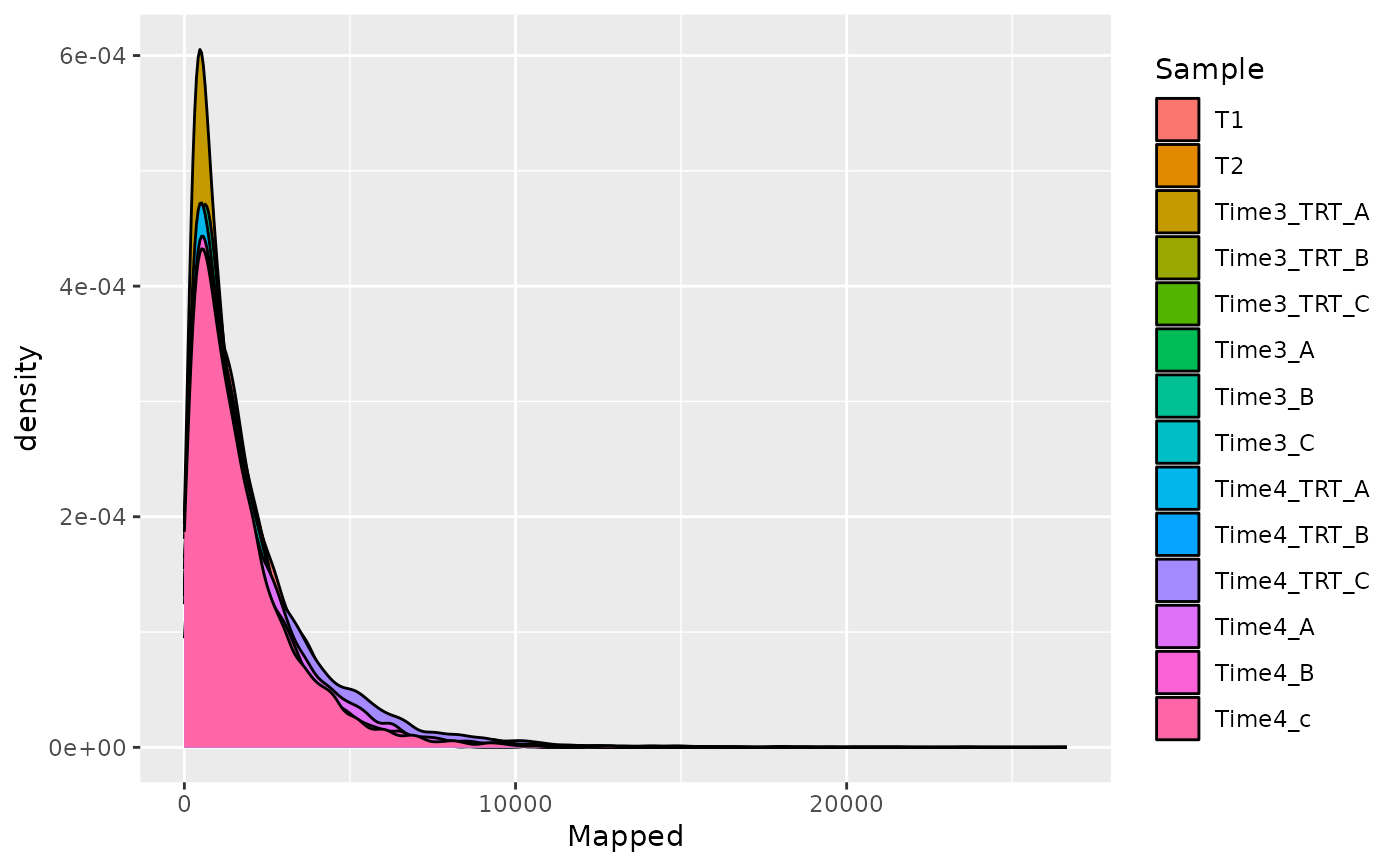
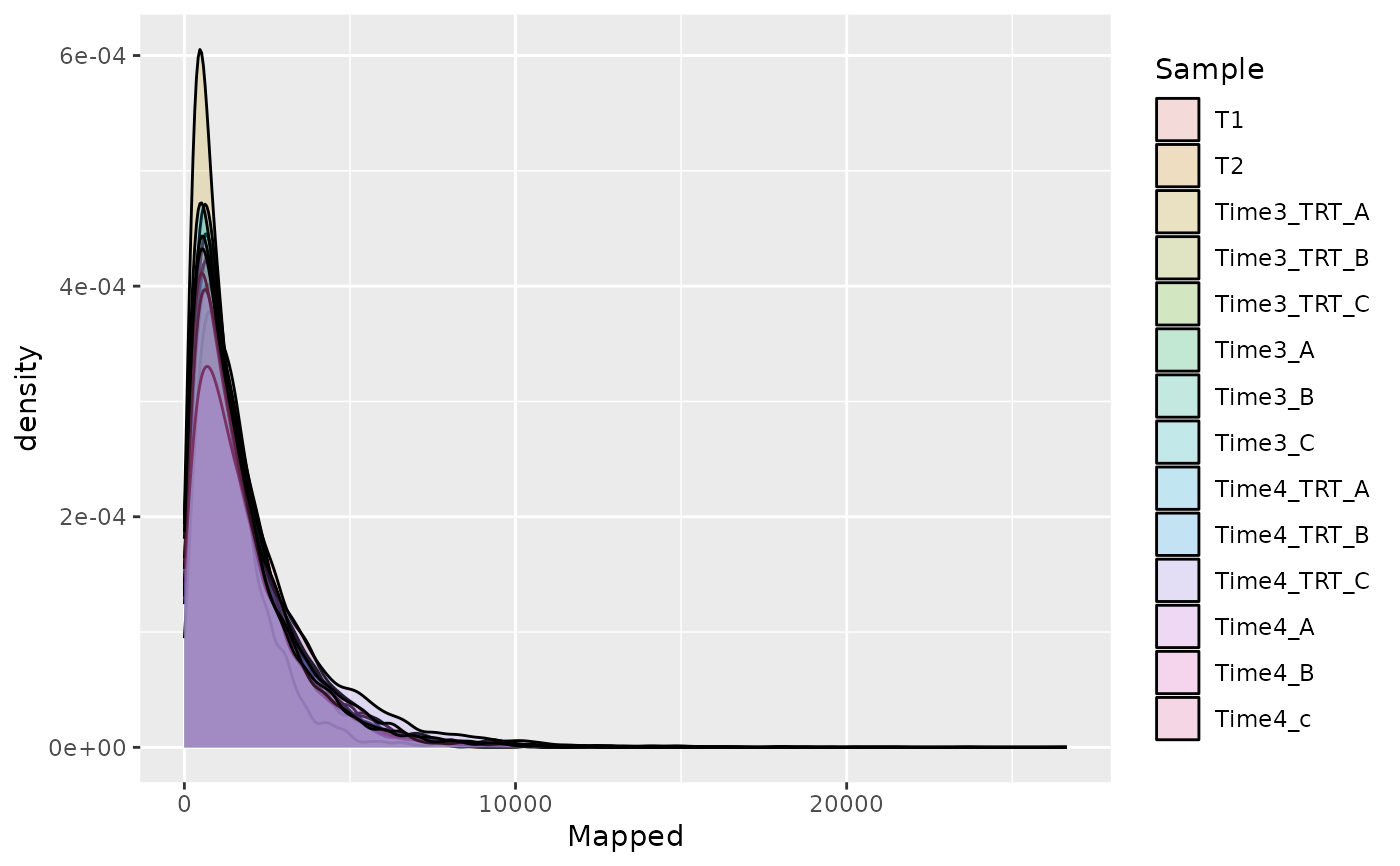
plot_mapped_reads_distribution.RdThis function creates a boxplot or a densityplot to show the distribution of the mapped reads in different samples. This function can be used to assess the quality of the samples. Samples which show roughly the same distribution have good quality.
Arguments
- screenR_Object
The ScreenR object obtained using the
create_screenr_object.- palette
The color vector that as to be used for the plot.
- alpha
A value for the opacity of the plot. Allowed values are in the range 0 to 1
- type
The type of plot. The default is "boxplot" the other option is "density."
Examples
object <- get0("object", envir = asNamespace("ScreenR"))

# Boxplot
plot_mapped_reads_distribution(object)


# Density
plot_mapped_reads_distribution(object, type = "density")


plot_mapped_reads_distribution(object, type = "density", alpha = 0.2)
