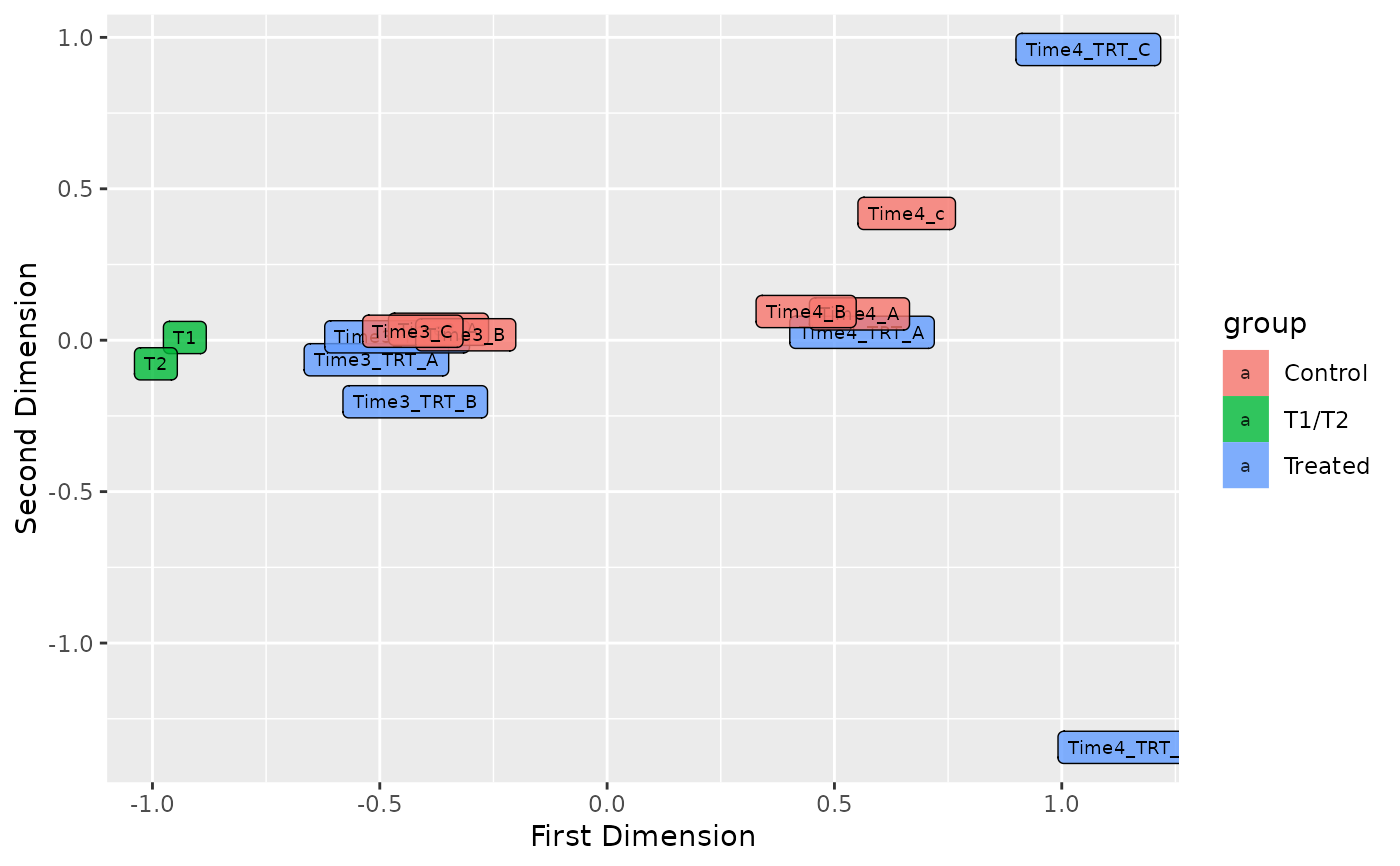
Plot samples on a two-dimensional scatterplot so that distances on the plot approximate the typical log2 fold changes between the samples.
Arguments
- screenR_Object
The Object of the package
create_screenr_object- groups
The vector that has to be used to fill the plot if NULL the function will use the default groups slot in the object passed as input.
- alpha
The opacity of the labels. Possible value are in a range from 0 to 1.
- size
The dimension of the labels. The default value is 2.5
- color
The color of the labels. The default value is black
Examples
object <- get0("object", envir = asNamespace("ScreenR"))

plot_mds(object)

