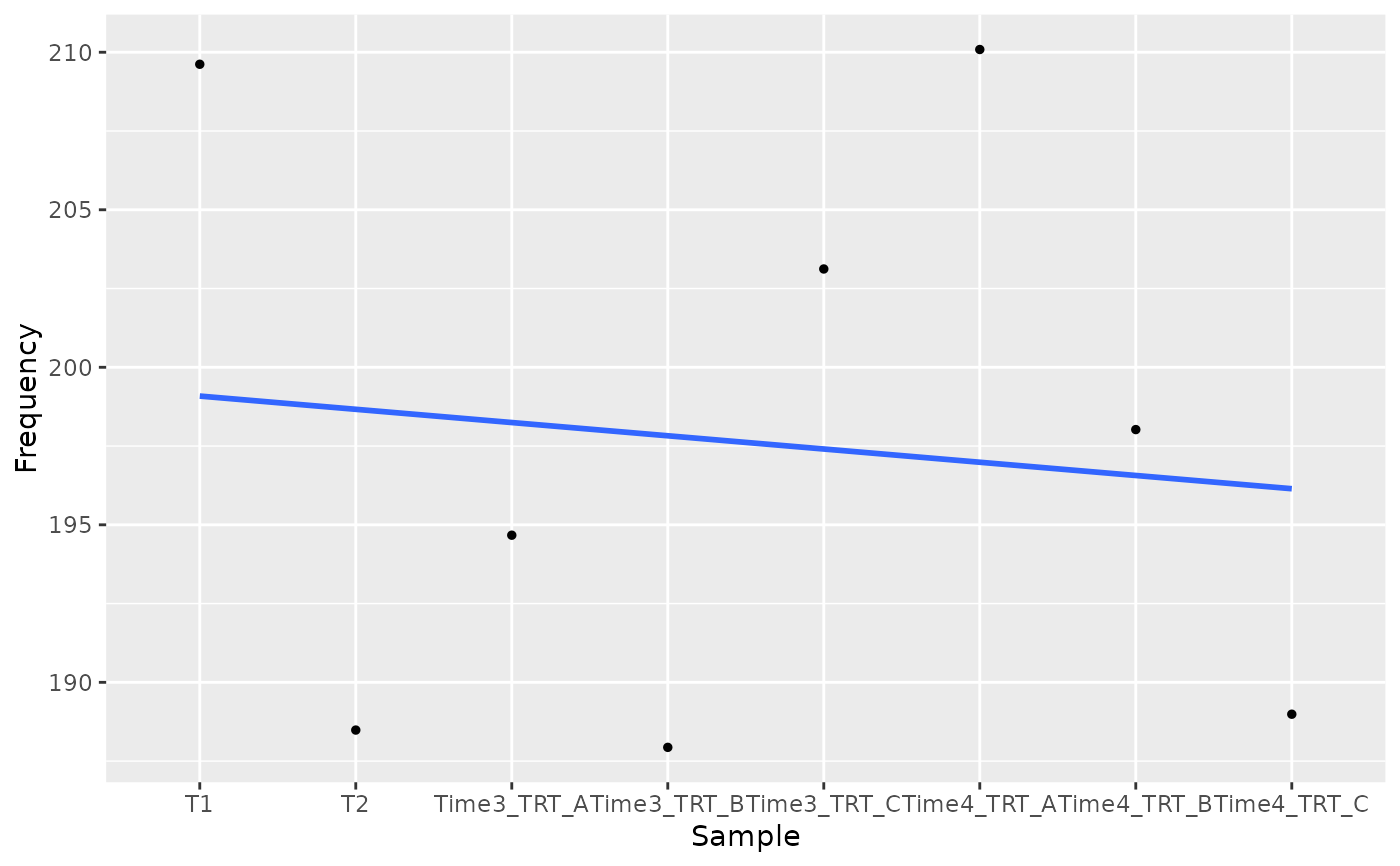
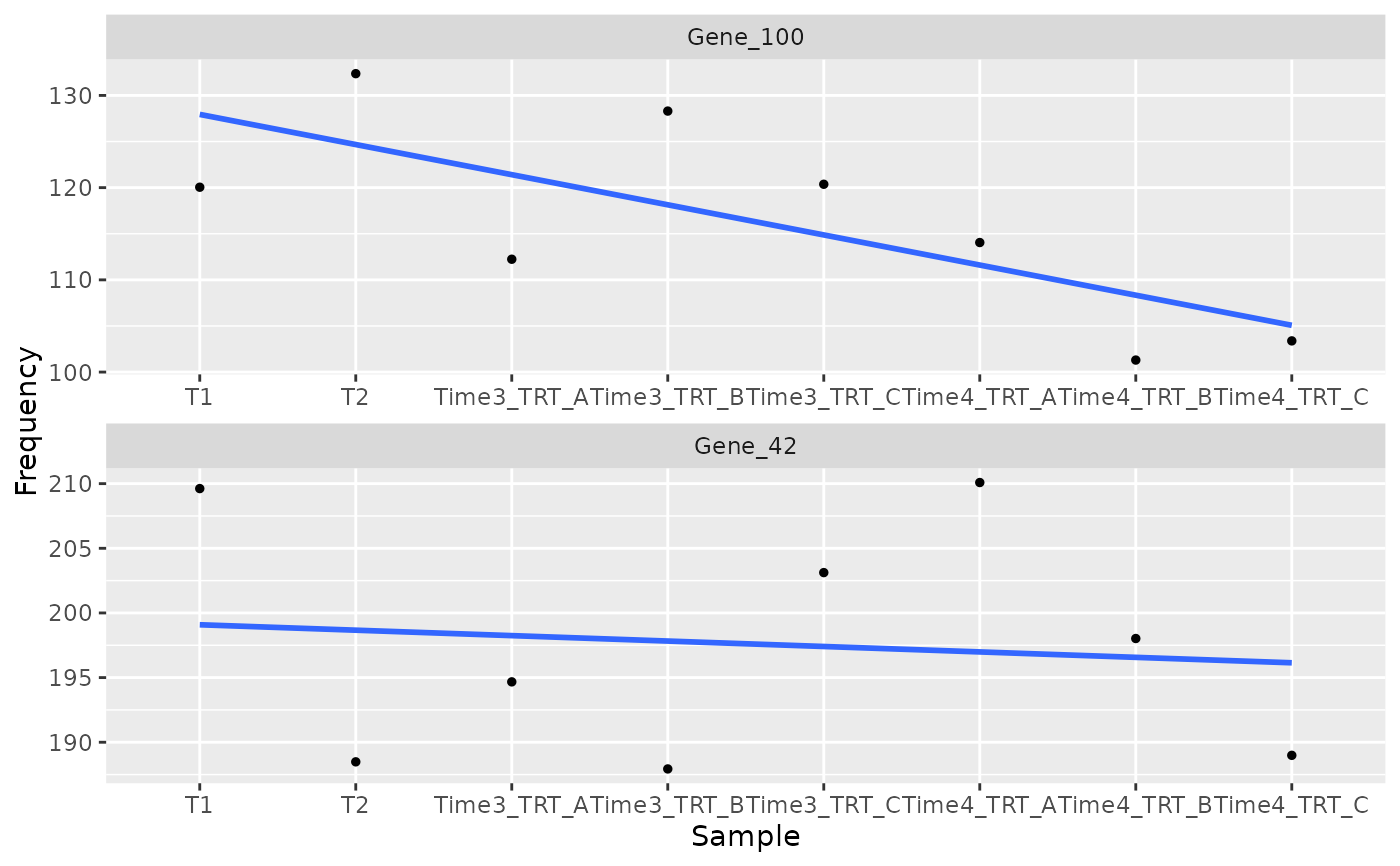
This function plot the trend of a gene resulted as hit
Usage
plot_trend(
  screenR_Object,
  genes,
  group_var,
  alpha = 0.5,
  se = FALSE,
  point_size = 1,
  line_size = 1,
  nrow = 1,
  ncol = 1,
  scales = "free"
)
Arguments
- screenR_Object
The ScreenR object obtained using the
create_screenr_object- genes
The vector of genes to use
- group_var
The variable that as to be used to filter the data, for example the different treatment
- alpha
A value for the opacity of the plot. Allowed values are in the range 0 to 1
- se
A boolean to indicate where or not to plot the standard error
- point_size
The dimension of each dot
- line_size
The dimension of the line
- nrow
The number of rows in case multiple genes are plotted
- ncol
The number of columns in case multiple genes are plotted
- scales
The scales to be used in the facette
Examples
object <- get0("object", envir = asNamespace("ScreenR"))

plot_trend(object, genes = "Gene_42", group_var = c("T1", "T2", "TRT"))


plot_trend(object,
    genes = c("Gene_42", "Gene_100"),
    group_var = c("T1", "T2", "TRT"),
    nrow = 2
)

