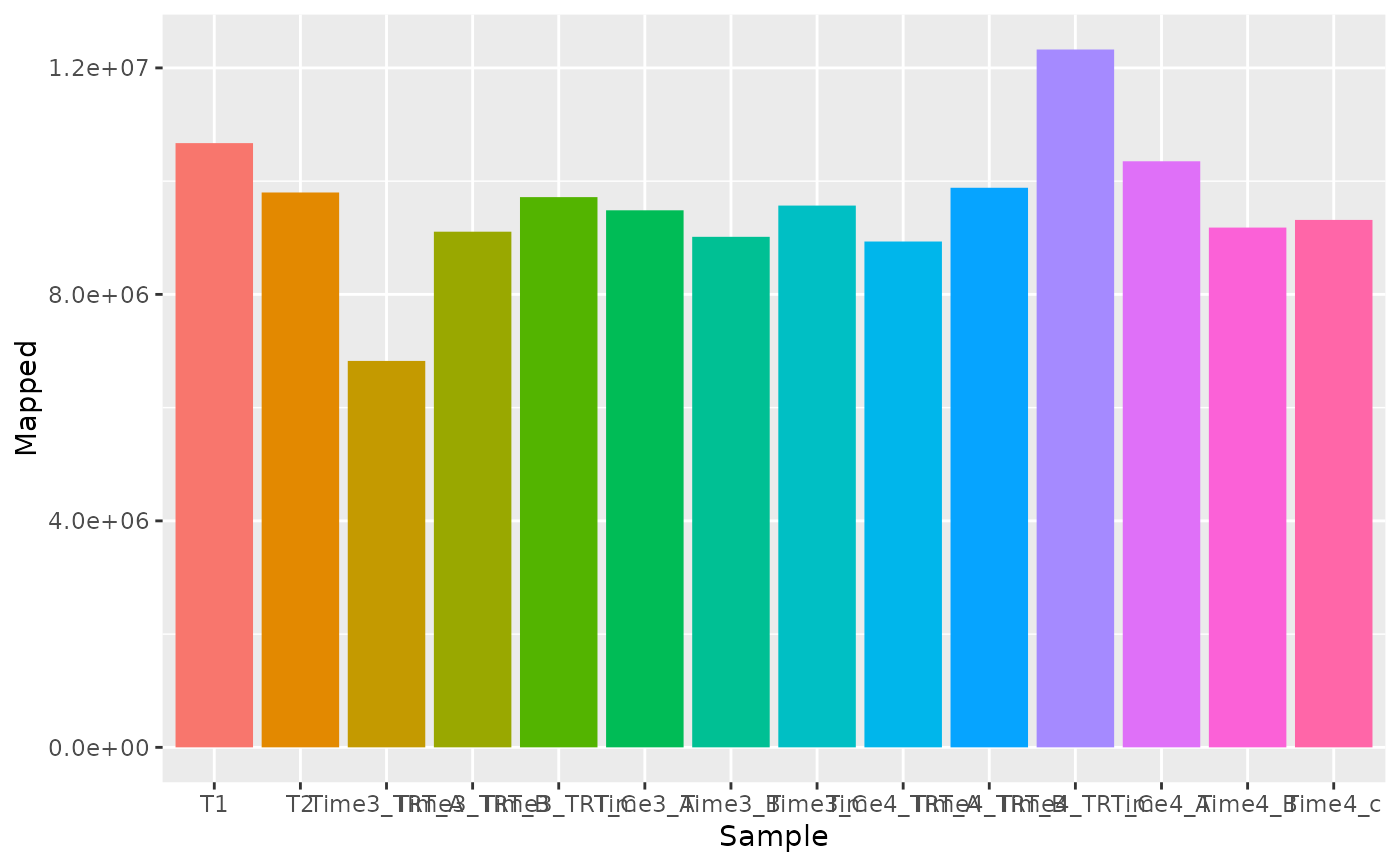
This function plots the number of reads mapped for each
sample. It internally call the count_mapped_reads
function, to compute the number of mapped reads.
Arguments
- screenR_Object
The ScreenR object obtained using the
create_screenr_object- palette
A vector of color that as to be used to fill the barplot.
- alpha
A value for the opacity of the plot. Allowed values are in the range 0 to 1
- legende_position
Where to positioning the legend of the plot ("none", "left", "right", "bottom", "top")
Examples
object <- get0("object", envir = asNamespace("ScreenR"))

plot_mapped_reads(object)

