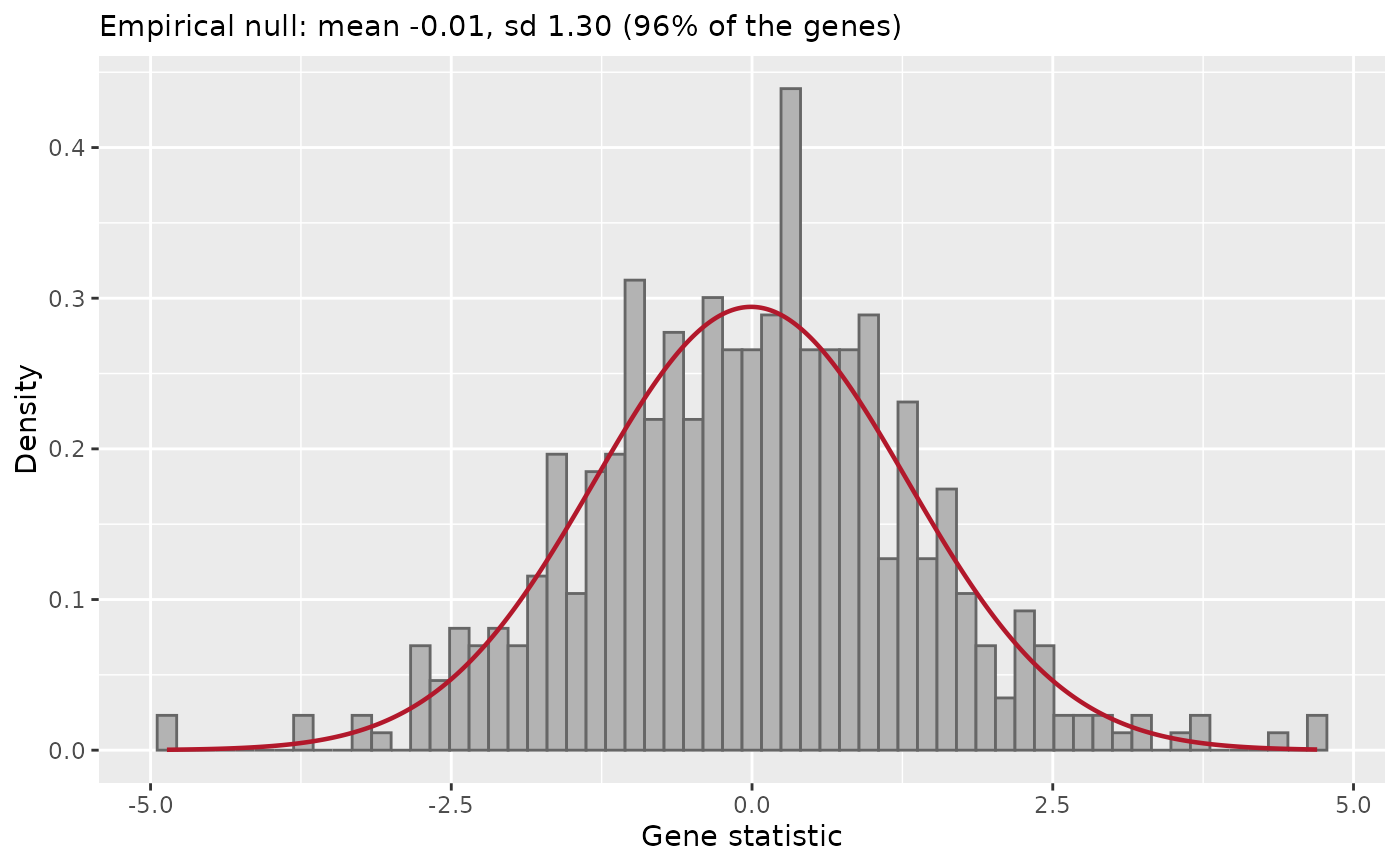
Plots the distribution of the gene statistics used by
find_gene_zscore_hit with reference = "empirical",
together with the fitted null (scaled to the share of genes it
describes). The null should follow the centre of the distribution; the
hits are in the tail on the side of direction.
Arguments
- table_treate_vs_control
A table with one row for each barcode and at least the columns Gene, Log2FC and the score column, as returned by
compute_metricsorcompute_barcode_statistics.- score
The column to use as score: "Zscore" (default) or "ZscoreRobust".
- direction
"Down" (default) or "Up".
- statistic
The gene score: "mean" (default) or "median".
- min_barcodes
Genes with fewer barcodes than this are not used (default 3).
- empirical_fit
"central" (default) or "one-sided".
- bins
The number of bins of the histogram. Default 60.
Examples
object <- get0("object", envir = asNamespace("ScreenR"))
table <- compute_metrics(object,
    control = "Time3", treatment = "TRT",
    day = "Time3"
)
plot_empirical_null(table)