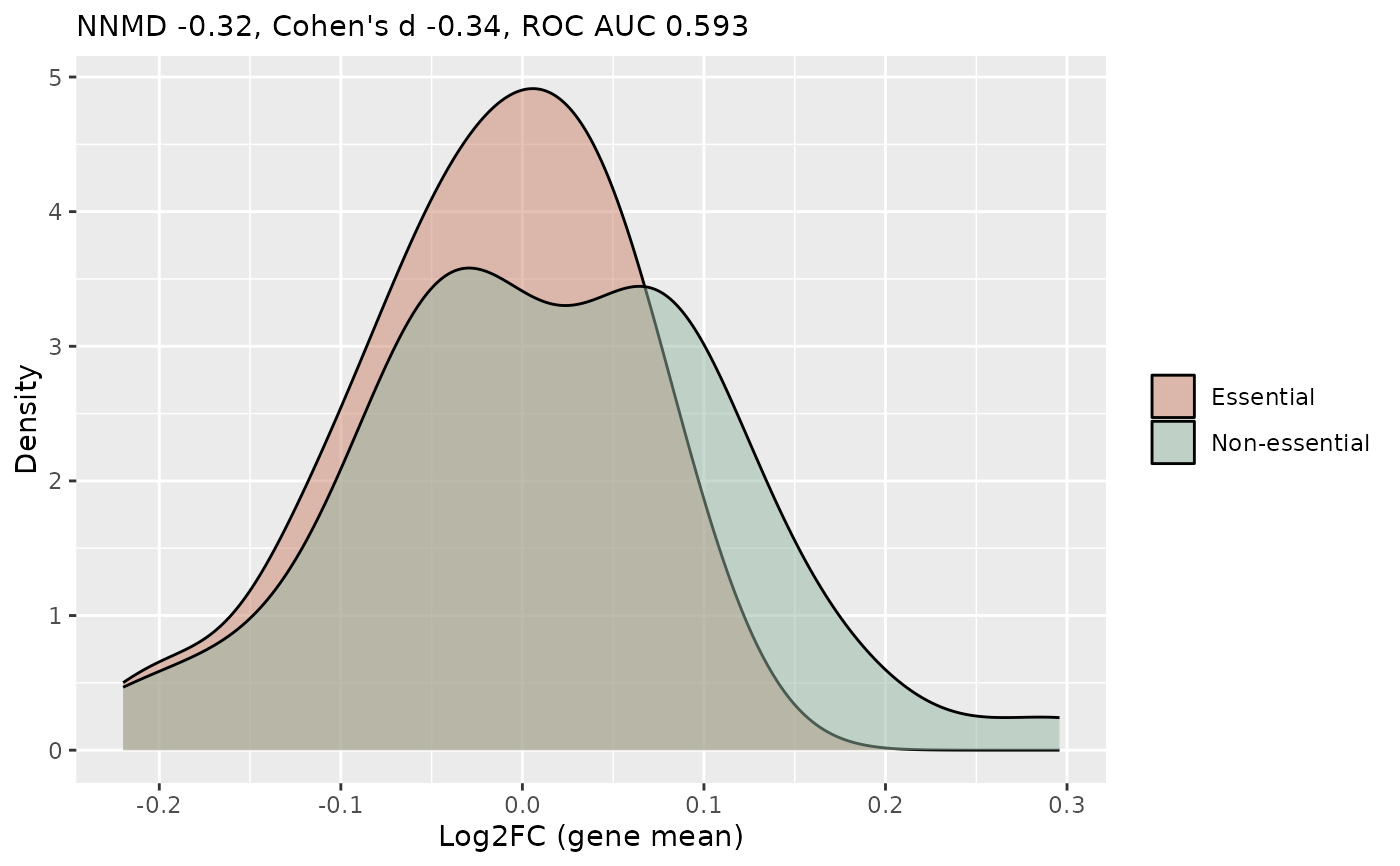
Plots the distribution of the scores (by default the log2
fold changes) of the essential and non-essential reference genes, with
the quality metrics of compute_screen_quality in the
subtitle. In a good dropout screen the two distributions are well
separated and the essential genes are on the left.
Usage
plot_reference_separation(
  table,
  essential,
  nonessential,
  score = "Log2FC",
  level = c("gene", "barcode"),
  alpha = 0.5
)
Arguments
- table
A table with one row for each barcode and the columns Gene and score, for example the output of
compute_metricsorcompute_barcode_statistics.- essential
The names of the essential genes (as in the Gene column).
- nonessential
The names of the non-essential genes.
- score
The column with the score (default "Log2FC").
- level
"gene" (default) to average the scores of the barcodes of each gene, or "barcode" to use each barcode.
- alpha
The transparency of the densities.
Examples
object <- get0("object", envir = asNamespace("ScreenR"))
metrics <- compute_metrics(object,
    control = "TRT", treatment = "Time3", day = "Time3"
)
# Example only: two arbitrary sets of genes used as references
genes <- unique(as.character(metrics$Gene))
plot_reference_separation(metrics,
    essential = genes[1:20], nonessential = genes[21:60]
)