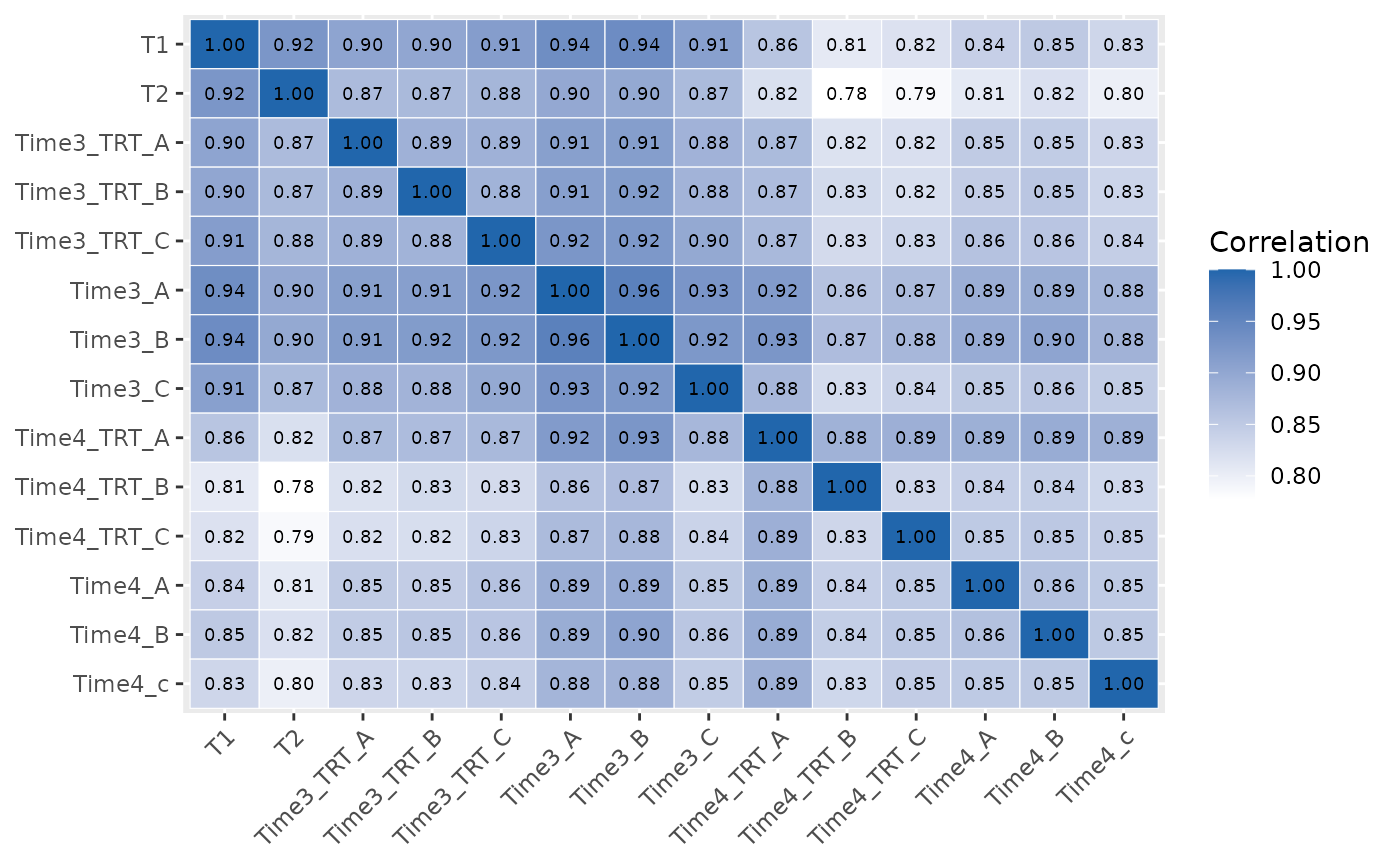
Plots, as a heatmap, the correlation between all the pairs of
samples, computed on log2(normalized count + 1), with the normalization
set by normalize_data (the + 1 is a display
transformation that keeps barcodes without reads finite). Replicates of
the same condition are expected to be highly correlated; a replicate
with a low correlation to the others may be an outlier. The object
must be normalized.
Usage
plot_replicate_correlation(
  screenR_Object,
  method = c("pearson", "spearman"),
  label = TRUE
)
Arguments
- screenR_Object
The ScreenR object obtained using
create_screenr_object.- method
The correlation method: "pearson" (default) or "spearman".
- label
Whether to write the correlation value in each tile (default TRUE).
Examples
object <- get0("object", envir = asNamespace("ScreenR"))
plot_replicate_correlation(object)