The palettes are the colors of the values of the sample
variables (the columns of the sample table: Sample, Day, Treatment,
and the Group and Replicate of each sample). They are stored in the
object and used by all the plots that color the samples by one of
these variables, so that, for example, the treated samples have the
same color in every plot. Set them with the palettes argument of
create_screenr_object or with set_palettes().
Arguments
- object
The ScreenR object obtained using
create_screenr_object.- palettes
A named list with one palette for each variable (see Details), or NULL to remove all the palettes.
Value
get_palettes(): a named list of named character vectors (empty when no palette is set). set_palettes(): the ScreenR object with the new palettes.
Details
A palette is given for each variable as a vector of colors:
named by the values of the variable, for example
Treatment = c(CTRL = "#1B9E77", TRT = "#D95F02"). It must give a color to every value of the variable; other names are allowed (for example values of samples that were removed);or unnamed, with at least as many colors as the variable has values: the colors are given to the values in the order of the samples (or of the levels, for a factor such as Group).
The palettes are stored named, in metadata(object)$palettes,
and are kept when the object is subset.
The plots use them as follows: an explicit palette given to the plot
(its palette argument) is used first; otherwise the palette of the
object for the variable that colors the plot; otherwise the default
colors of ggplot2. The plots that use them are
plot_mapped_reads, plot_mapped_reads_distribution,
plot_barcode_lost, plot_barcode_lost_for_gene,
plot_gini (Sample), plot_mds and
plot_pca (Group, or the variable given in groups) and
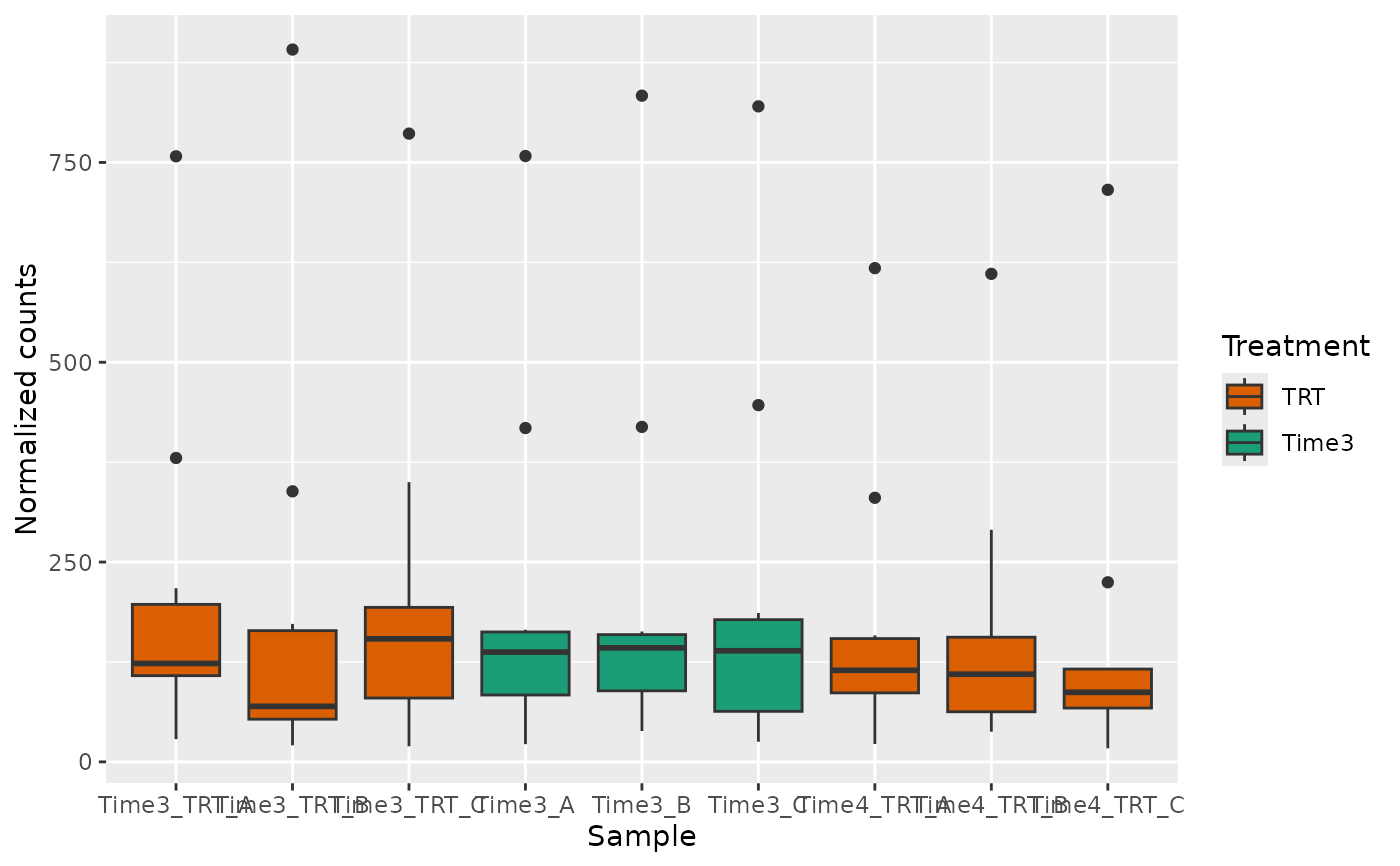
plot_boxplot (the variable of fill_var). The plots that
do not receive the object, such as plot_zscore_distribution,
take the palette as an argument, for example
palette = get_palettes(object)$Day.
Examples
object <- get0("object", envir = asNamespace("ScreenR"))
object <- set_palettes(object, list(
    Treatment = c(T1 = "grey70", T2 = "grey40", Time3 = "#1B9E77",
        Time4 = "#66A61E", TRT = "#D95F02"),
    Day = c("#E6AB02", "#A6761D", "#7570B3", "#E7298A")
))
get_palettes(object)
#> $Treatment
#>        T1        T2     Time3     Time4       TRT
#>  "grey70"  "grey40" "#1B9E77" "#66A61E" "#D95F02"
#>
#> $Day
#>        T1        T2     Time3     Time4
#> "#E6AB02" "#A6761D" "#7570B3" "#E7298A"
#>
plot_boxplot(object, genes = "Gene_34", group_var = c("Time3", "TRT"),
    fill_var = "Treatment")